There's a little trick I sometimes pull when my mouse accidentally slips on the back button while I was writing something on a web page (don't ask). Before I show you a demo, I want to explain what's going on behind the scenes so you can understand what I'm doing.
When you navigate away from a page, behind the scenes one of two things happen: either the browser frees the memory associated with the page, or it keeps the rendered page in a cache in case you decide to revisit it. Even when the memory is freed, the data usually stays around for a little while longer, at least until there have been enough free()'s to call the OS allocator. (Remember that the CRT is an allocation cache on top of the OS allocator.) Either way, if you've got a long enough pattern, you can just search for it in the process' memory space. It's crude, but it sometimes works. And here's how it's done:
First Step: Get the page's PID from Chrome's about:memory page
This is why this post is called "Google Chrome Rocks!" Normally this step is painful with Internet Explorer and Firefox because all pages are in the same (main) process, so they all become unresponsive when I debug the process. Chrome allows me to debug a single page, while still browsing in the other tabs.
Second Step: Fire up WinDbg and attach to that process
If you don't have WinDbg installed, use Process Explorer to suspend the process (right-click, Suspend). You could even get Visual Studio attached in the interim, but you will have to also suspend with Process Explorer during the hand-off to WinDbg.
Go to File | Attach to a Process... (F6) and choose the process:
Once WinDbg has attached, you're safe -- the process is suspended so its memory won't be reclaimed by the OS.
Third Step: Look for a pattern in what you were writing
It can be as simple as a word like "gliding". Of course, this will entirely depend on what you were writing.
For example, use the WinDbg command "s -a".
In my case, I can see that the last match is the right one. Use "db" to work your backwards to the beginning of the string.
Remember that your string might be stored in Unicode and try different patterns.
Fourth Step: Extract the recovered string
The text is too long for "da", but WinDbg has a ".printf" command. Don't be afraid to use the manual to come up with crazy techniques like this one. Sadly, the comma is not documented.
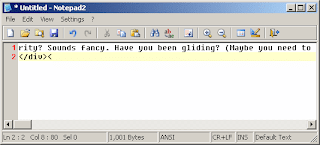
Fifth Step: Paste into notepad

Once this is done, you can release the process from the debugger. Make sure to use Debug | Detach Debuggee so you don't kill the process.
Then simply hit the Forward button and paste your text back into the editor :)
What would be really fun is writing a driver that can freeze the entire system and search physical memory for a particular pattern. This would catch even memory freed by the OS. Unfortunately, under Windows, VirtualFree'd memory is zero'ed by a background kernel thread, so the window of opportunity could be quite small.
Until next time,
Good night.


